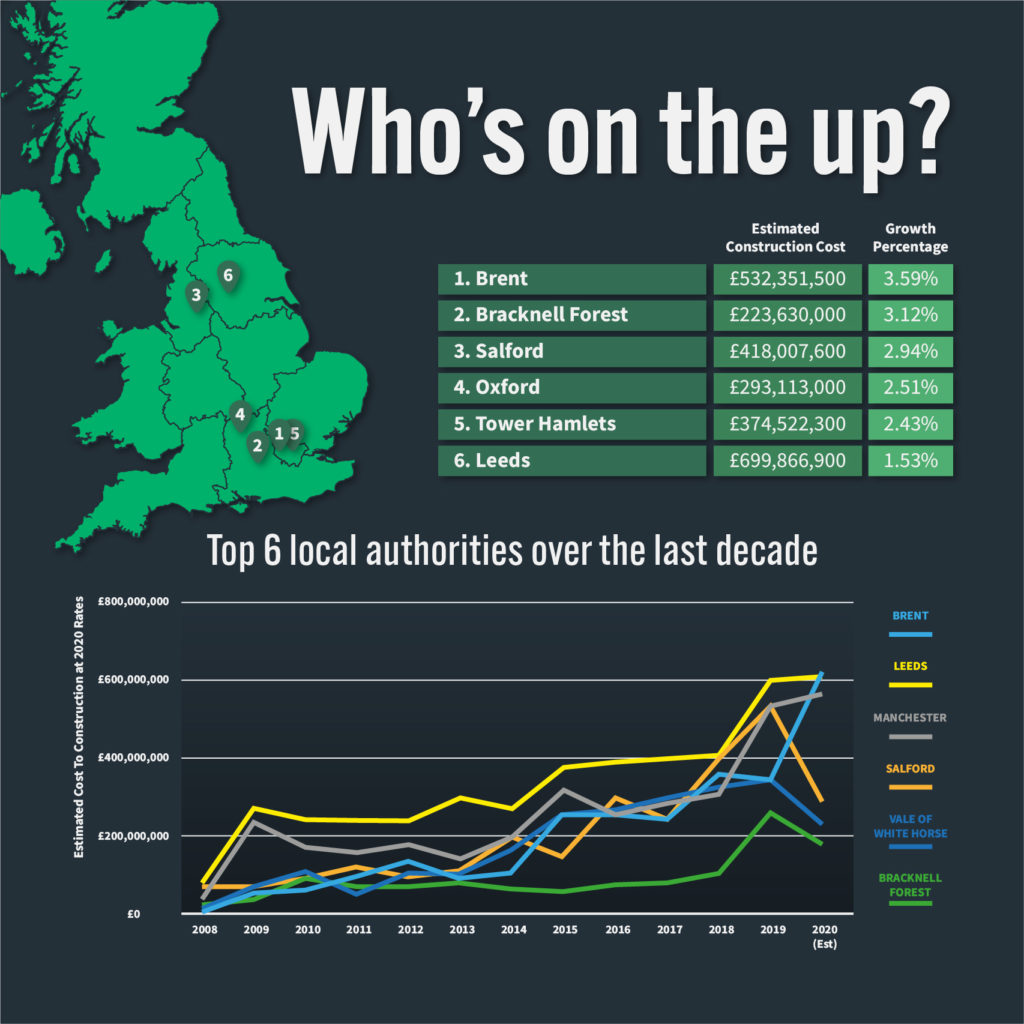
Brent is currently the fastest growing location in the UK for housing development, according to new research from Protrade Tools and Fixings. The East Midlands’ supplier of trade tools searched through free-to-access data analysing domestic housing construction completed during Q3 2019 and Q2 2020 across all the UK’s local authorities.
The latest information shows that Brent grew by more than 3.5% during the aforementioned period and spent an estimated £532,351,500 on housing construction.
It represents a sharp incline of growth from the authority which has grown steadily since 2008. Brent spent £346,459,300 on housing construction during the entirety of 2019.
Making up the top five growing local authorities in the UK were Bracknell Forest (3.12%), Salford (2.94%), Vale of White Horse (2.51%), and Tower Hamlets (2.43%).
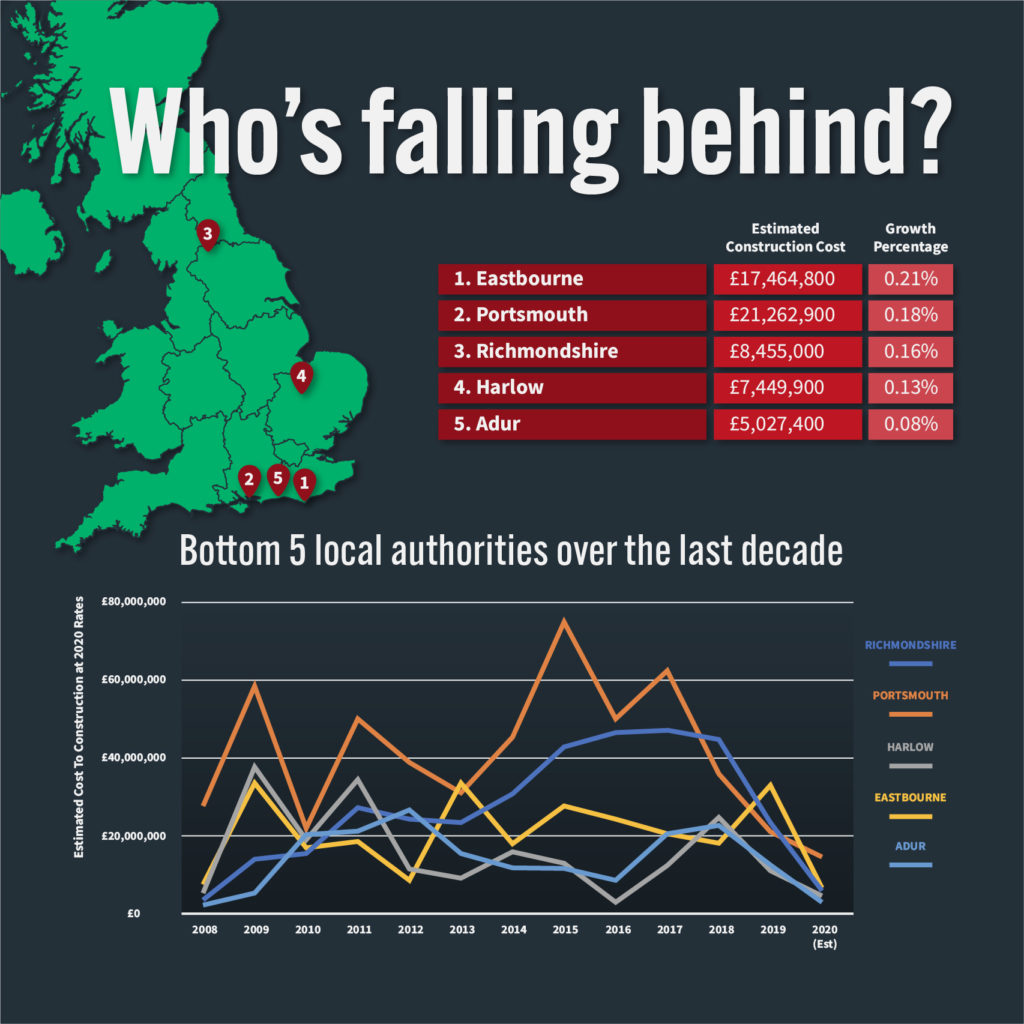
In a table of 308* local authorities, the bottom five were made up of Adur (0.08%), Harlow (0.13%), Richmondshire (0.16%), Portsmouth (0.18%), and Eastbourne (0.21%).
| League table | The UK’s fastest-growing housing development locations Q3 2019 – Q2 2020 |
||||
| – | Authority | SUM of Total Floor Area (m2) | Estimated construction cost | Number of new houses | Growth (%) |
| 1 | Brent | 280,185 | £532,351,500 | 4,329 | 3.59% |
| 2 | Bracknell Forest | 117,700 | £223,630,000 | 1,569 | 3.12% |
| 3 | Salford | 220,004 | £418,007,600 | 3,511 | 2.94% |
| 4 | Vale of White Horse | 154,270 | £293,113,000 | 1,475 | 2.51% |
| 5 | Tower Hamlets | 197,117 | £374,522,300 | 2,953 | 2.43% |
| 6 | South Derbyshire | 108,944 | £206,993,600 | 1,033 | 2.28% |
| 7 | Wokingham | 151,190 | £287,261,000 | 1,543 | 2.25% |
| 8 | Basingstoke and Deane | 146,805 | £278,929,500 | 1,710 | 2.25% |
| 9 | West Oxfordshire | 103,080 | £195,852,000 | 1,039 | 2.12% |
| 10 | Ribble Valley | 62,857 | £119,428,300 | 575 | 2.10% |
Analysing this data, Craig Sanders, Managing Director at Protrade, said: “The COVID-19 pandemic has had a huge impact across a number of sectors, with construction also being hit hard during the first lockdown. However, it has bounced back from its contraction back in Spring 2020 and continues to be one of the main drivers for the recovery of the UK economy.
“Despite difficulties the United Kingdom has faced, there has still been significant demand across the country for new builds, almost certainly helped by the cut of stamp duty. The ongoing lack of affordable housing has also fuelled the requirement for new homes.”
Craig added: “These numbers make for interesting reading and paints a clear picture of which areas are investing the most in house construction, and ultimately helping to tackle the ongoing UK housing crisis.”
Beyond organising these local authorities into a league table, this data also provided some further interesting angles and talking points.
Brent’s growing the quickest but how does that compare to its London neighbours?
So, Brent is the fastest growing area across the UK for housing development, but how does that compare with the rest of the Capital?
Below, Protrade has taken the list of 32 London-based local authorities, based on this list here, to create a league table from the data that has been collated. This is how they shape up:
| League table | London’s fastest-growing housing development locations Q3 2019 – Q2 2020 |
||||
| – | Authority | SUM of Total Floor Area (m2) | Estimated construction cost | Number of new houses | Growth (%) |
| 1 | Brent | 280,185 | £532,351,500 | 4,329 | 3.59% |
| 2 | Tower Hamlets | 197,117 | £374,522,300 | 2,953 | 2.43% |
| 3 | Ealing | 151,236 | £287,348,400 | 2,187 | 1.62% |
| 4 | Newham | 133,117 | £252,922,300 | 1,864 | 1.59% |
| 5 | Greenwich | 118,173 | £224,528,700 | 1,640 | 1.43% |
| 6 | Waltham Forest | 101,040 | £191,976,000 | 1,418 | 1.37% |
| 7 | Hounslow | 78,111 | £148,410,900 | 1,361 | 1.34% |
| 8 | Hackney | 104,398 | £198,356,200 | 1,421 | 1.27% |
| 9 | Lambeth | 121,383 | £230,627,700 | 1,709 | 1.21% |
| 10 | Wandsworth | 131,646 | £250,127,400 | 1,683 | 1.14% |
| 11 | Barking and Dagenham | 65,985 | £125,371,500 | 863 | 1.14% |
| 12 | Croydon | 121,959 | £231,722,100 | 1,826 | 1.13% |
| 13 | Westminster | 133,420 | £253,498,000 | 1,377 | 1.10% |
| 14 | Harrow | 64,271 | £122,114,900 | 982 | 1.07% |
| 15 | Hillingdon | 70,277 | £133,526,300 | 1,107 | 1.00% |
| 16 | Hammersmith and Fulham | 69,645 | £132,325,500 | 862 | 0.97% |
| 17 | Barnet | 103,810 | £197,239,000 | 1,197 | 0.78% |
| 18 | Islington | 56,250 | £106,875,000 | 751 | 0.72% |
| 19 | Southwark | 70,104 | £133,197,600 | 961 | 0.71% |
| 20 | Merton | 48,082 | £91,355,800 | 547 | 0.65% |
| 21 | Havering | 45,792 | £87,004,800 | 610 | 0.60% |
| 22 | Camden | 49,899 | £94,808,100 | 601 | 0.57% |
| 23 | Sutton | 34,875 | £66,262,500 | 479 | 0.57% |
| 24 | Redbridge | 42,951 | £81,606,900 | 577 | 0.55% |
| 25 | Haringey | 42,124 | £80,035,600 | 601 | 0.55% |
| 26 | Lewisham | 48,179 | £91,540,100 | 650 | 0.51% |
| 27 | Enfield | 54,139 | £102,864,100 | 598 | 0.47% |
| 28 | Kingston upon Thames | 26,152 | £49,688,800 | 299 | 0.44% |
| 29 | Richmond upon Thames | 39,994 | £75,988,600 | 364 | 0.43% |
| 30 | Bromley | 49,261 | £93,595,900 | 494 | 0.35% |
| 31 | Bexley | 28,346 | £53,857,400 | 325 | 0.33% |
| 32 | Kensington and Chelsea | 18,351 | £34,866,900 | 225 | 0.26% |
| Totals | £5,130,516,800 | 36,861 | 1.00% | ||
While Brent is way out in front in terms of growth, there are a number of other interesting statistics we can pull from this:
- Combined, the London-based local authorities spent over £5bn on new-builds between Q3 2019 and Q2 2020
- Together, there were an estimated 36,861 new dwellings built during this period
- 14 of London’s local authorities developed more than 1,000 new homes during the stated time period
Leeds, the Kings of the North?
For many years now, Leeds has been considered the ‘London of the North’, and this latest information continues to support that.
Out of the 308 local authorities listed, Leeds may not have featured among the top growing but it did spend the most during Q3 2019 and Q2 2020, investing an estimated £699,866,900 into housing construction and more than 5,000 new houses.
The latest data does mean that Leeds retains its place among the top five growing local authorities in the UK over the last decade. It’s also regularly considered as the best city to live in when it comes to quality of life.
Unsurprisingly, Manchester also features in this list following their biggest financial outlay in housing construction since 2015, investing approximately £540,831,200 — a whopping £220m more than its previous top investment.
Portsmouth may be in the bottom five, but that doesn’t tell the whole story
Looking back at when records began — in 2008 — Portsmouth was one of the biggest growth areas in the UK, spending far more than three of the current top five — Brent, Vale of White Horse, and Bracknell Forest — in that year. For many years, though, Portsmouth has also been regarded as the most densely populated area in the UK.
The latest information shows that with 90,780 the city sits within the top 100 local authorities for current dwellings and is a huge figure considering the city only has a total floor area of 11,191m2, the 12th lowest out of the 308 authorities included this data.
Regardless of that, Portsmouth has spent approximately £519,989,283 on housing construction since 2008, showing that it is not afraid of putting its money where its mouth is when the opportunity arises to invest in new housing projects.
Is Vale of White Horse becoming a UK hotspot?
Famous for its expansive hills and rich history, there’s a reason that Oxfordshire has a great appeal when it comes to places to reside in the UK. Vale of White Horse is part of the county and has repeatedly been voted as one of the country’s best places to live, a fact that is backed up by this data.
Vale of White Horse has been the only location in the current top five to show year-on-year growth with its housing construction expenditure — growing from £53,491,899 in 2011 to £346,162,900 in 2019. That is a trend that is likely to continue into the future due to the sheer volume of space the area boasts. Of the 308 local authorities, Vale of White Horse is in the top 15 for total floor area — 154,270m2 — which is being filled by just over 58,000 dwellings, meaning there is far more room for potential growth in the years to come.
Methodology
The data, acquired from the Ministry of Housing, Communities and Local Government, takes into account three factors to provide a growth percentage for each of the UK’s local authorities. These are:
- Sum of total floor area (m2)
- Number of new lodgements
- Number of dwellings
Beyond that, the available data also provided an estimated construction cost.
The provided information also dates back to 2008, which showcased how each local authority had grown over a 12-year period up to the end of Q2 2020. The full data can be accessed here.