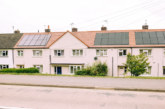
The Isles of Scilly is the local authority with the least energy-efficient homes in England and Wales, with a median score of 49[1], reveals analysis of 23 million EPCs by Uswitch.com, the comparison service.
Uswitch’s ranking of 331 local authorities revealed that Wales makes up five of the 10 of the local authorities with the least efficient homes. All of the areas with the hardest to heat homes have scores of 62 or below.
Single-glazed windows, uninsulated walls and roofs, and electric room heaters are common problems that push up the cost of heating inefficient homes.
Table: Ten local authorities with least energy efficient homes
| Rank | Local Authority | Number of addresses | Median energy efficiency score |
| 1 | Isles of Scilly | 649 | 49 |
| 2= | Gwynedd | 32,068 | 58 |
| 2= | Ceredigion | 20,915 | 58 |
| 4 | Isle of Anglesey | 19,706 | 60 |
| 5 | Pendle | 24,383 | 61 |
| 5= | Eden | 16,134 | 61 |
| 5= | Carmarthenshire | 45,020 | 61 |
| 8 | West Devon | 14,674 | 62 |
| 8= | Southend-on-Sea | 47,650 | 62 |
| 8= | Powys | 35,276 | 62 |
Source: Uswitch.com
Flats and maisonettes are the most energy-efficient homes in general, with park homes and bungalows commonly seeing greater heat loss. New-build homes are much more likely to have a higher EPC rating due to good insulation, and some even have solar panels and heat pumps pre-installed.
Five of the best-performing local authorities in the country are in London, led by Tower Hamlets, with homes scoring 74 on average for energy efficiency. New flats have been built in many parts of the capital in recent years, which may have pushed up the average score in those areas.
Table: Ten local authorities with most energy-efficient homes
| Rank | Local Authority | Number of addresses | Median energy efficiency score |
| 1 | Tower Hamlets | 102,340 | 77 |
| 2 | City of London | 4,545 | 74 |
| 3= | Salford | 92,126 | 72 |
| 3= | Southwark | 86,598 | 72 |
| 5= | Cambridge | 36,738 | 71 |
| 5= | Greenwich | 75,853 | 71 |
| 5= | Hackney | 75,877 | 71 |
| 5= | Milton Keynes | 75,101 | 71 |
| 9= | Knowsley | 46,339 | 70 |
| 9= | Basingstoke and Deane | 43,195 | 70 |
Source: Uswitch.com
Uswitch.com encourages households to check their home’s EPC certificate online, and see what improvements they could make to save money and energy.
Natalie Mathie, energy expert at Uswitch.com, commented: “The Isles of Scilly is a beautiful part of the UK, but its older housing stock unfortunately means residents are losing a lot of heat through uninsulated walls and roofs.
“Modern new-build properties need to meet more stringent efficiency standards, which may be why London boroughs have scored highly in the ranking.
“Every bit of heat that escapes your home will cost you money, so it’s worth knowing how efficient your home is. Take a moment to look up your home’s EPC certificate online and see where your property could be improved — the reports are incredibly detailed and will give you estimated costs for all the energy-saving measures.
“You can’t always tell if these changes are making a difference until you see your bill — unless you track your usage. People using the Utrack app can see the impact on their bills with hourly graphs, comparing gas and electricity use by day, week, month and year.”
- Uswitch analysis of 23 million EPC certificates. Only roads with at least four EPC certificates and eight Unique Property Reference Numbers were considered. Data available on request. EPC rating goes from 0 to 100. An EPC rating of above 100 means that the property generates more energy than it uses.
Header image ©mattiagenini/AdobeStock
Table: Full list of local authorities’ energy efficiency scores
| Rank | Local Authority | Number of addresses | Median energy efficiency score |
| 1 | Isles of Scilly | 649 | 49 |
| 2 | Gwynedd | 32,068 | 58 |
| 3 | Ceredigion | 20,915 | 58 |
| 4 | Isle of Anglesey | 19,706 | 60 |
| 5= | Pendle | 24,383 | 61 |
| 5= | Eden | 16,134 | 61 |
| 5= | Carmarthenshire | 45,020 | 61 |
| 8= | West Devon | 14,674 | 62 |
| 8= | Southend-on-Sea | 47,650 | 62 |
| 8= | Powys | 35,276 | 62 |
| 8= | North Norfolk | 31,332 | 62 |
| 8= | Denbighshire | 26,974 | 62 |
| 8= | Castle Point | 18,847 | 62 |
| 8= | Calderdale | 54,522 | 62 |
| 8= | Bradford | 135,373 | 62 |
| 8= | Blackpool | 46,916 | 62 |
| 17= | Staffordshire Moorlands | 21,893 | 63 |
| 17= | South Hams | 26,916 | 63 |
| 17= | Ryedale | 15,670 | 63 |
| 17= | Rossendale | 17,444 | 63 |
| 17= | Pembrokeshire | 33,377 | 63 |
| 17= | King’s Lynn and West Norfolk | 42,982 | 63 |
| 17= | Hyndburn | 22,183 | 63 |
| 17= | East Lindsey | 42,221 | 63 |
| 17= | Derbyshire Dales | 19,236 | 63 |
| 17= | Conwy | 32,594 | 63 |
| 17= | Burnley | 26,664 | 63 |
| 17= | Barrow-in-Furness | 17,796 | 63 |
| 29= | Torridge | 19,998 | 64 |
| 29= | Tendring | 41,964 | 64 |
| 29= | South Lakeland | 29,390 | 64 |
| 29= | Scarborough | 34,136 | 64 |
| 29= | Richmondshire | 13,377 | 64 |
| 29= | Rhondda Cynon Taf | 56,740 | 64 |
| 29= | North East Lincolnshire | 41,615 | 64 |
| 29= | Melton | 12,934 | 64 |
| 29= | Lancaster | 35,134 | 64 |
| 29= | Forest of Dean | 21,376 | 64 |
| 29= | Erewash | 27,050 | 64 |
| 29= | Craven | 14,630 | 64 |
| 29= | Cornwall | 166,415 | 64 |
| 29= | Copeland | 16,675 | 64 |
| 29= | Broxtowe | 25,539 | 64 |
| 29= | Blaenau Gwent | 15,974 | 64 |
| 29= | Birmingham | 273,668 | 64 |
| 29= | Allerdale | 26,269 | 64 |
| 47= | Wyre Forest | 24,304 | 65 |
| 47= | Wyre | 29,943 | 65 |
| 47= | Worthing | 30,606 | 65 |
| 47= | Wolverhampton | 63,138 | 65 |
| 47= | Wirral | 87,686 | 65 |
| 47= | Trafford | 56,479 | 65 |
| 47= | Torbay | 40,314 | 65 |
| 47= | Swansea | 59,539 | 65 |
| 47= | Stockport | 69,980 | 65 |
| 47= | Sevenoaks | 26,042 | 65 |
| 47= | Sefton | 75,348 | 65 |
| 47= | Sandwell | 72,826 | 65 |
| 47= | Rother | 27,078 | 65 |
| 47= | Richmond upon Thames | 48,292 | 65 |
| 47= | Redbridge | 62,120 | 65 |
| 47= | Oldham | 56,495 | 65 |
| 47= | Oadby and Wigston | 13,242 | 65 |
| 47= | North Warwickshire | 16,588 | 65 |
| 47= | Mole Valley | 20,588 | 65 |
| 47= | Mid Devon | 20,991 | 65 |
| 47= | Malvern Hills | 20,985 | 65 |
| 47= | Maldon | 15,421 | 65 |
| 47= | Leicester | 90,562 | 65 |
| 47= | Kirklees | 101,384 | 65 |
| 47= | Kingston upon Thames | 41,179 | 65 |
| 47= | Herefordshire, County of | 48,862 | 65 |
| 47= | Havering | 57,811 | 65 |
| 47= | Hambleton | 26,081 | 65 |
| 47= | Great Yarmouth | 26,890 | 65 |
| 47= | Gedling | 30,070 | 65 |
| 47= | Fylde | 24,270 | 65 |
| 47= | Enfield | 77,684 | 65 |
| 47= | East Riding of Yorkshire | 89,841 | 65 |
| 47= | Dudley | 69,216 | 65 |
| 47= | Derby | 65,435 | 65 |
| 47= | Cotswold | 25,763 | 65 |
| 47= | Bury | 45,878 | 65 |
| 47= | Bromley | 77,494 | 65 |
| 47= | Blackburn with Darwen | 37,067 | 65 |
| 47= | Bexley | 54,540 | 65 |
| 47= | Amber Valley | 31,019 | 65 |
| 47= | Adur | 14,508 | 65 |
| 89= | West Lindsey | 27,619 | 66 |
| 89= | West Lancashire | 26,508 | 66 |
| 89= | Wealden | 39,104 | 66 |
| 89= | Waltham Forest | 71,811 | 66 |
| 89= | Walsall | 65,037 | 66 |
| 89= | Tunbridge Wells | 29,731 | 66 |
| 89= | Thanet | 42,790 | 66 |
| 89= | Teignbridge | 36,147 | 66 |
| 89= | Tandridge | 20,026 | 66 |
| 89= | Sutton | 49,165 | 66 |
| 89= | Stroud | 30,327 | 66 |
| 89= | Stoke-on-Trent | 65,814 | 66 |
| 89= | St. Helens | 45,038 | 66 |
| 89= | Spelthorne | 25,023 | 66 |
| 89= | South Staffordshire | 22,829 | 66 |
| 89= | South Holland | 24,851 | 66 |
| 89= | Shropshire | 83,340 | 66 |
| 89= | Rotherham | 62,476 | 66 |
| 89= | Rochford | 18,279 | 66 |
| 89= | Ribble Valley | 15,661 | 66 |
| 89= | Redcar and Cleveland | 36,287 | 66 |
| 89= | Portsmouth | 57,749 | 66 |
| 89= | Nuneaton and Bedworth | 32,972 | 66 |
| 89= | North Lincolnshire | 41,722 | 66 |
| 89= | North East Derbyshire | 25,363 | 66 |
| 89= | North Devon | 28,972 | 66 |
| 89= | Newcastle-under-Lyme | 28,220 | 66 |
| 89= | New Forest | 42,172 | 66 |
| 89= | Neath Port Talbot | 36,489 | 66 |
| 89= | Merthyr Tydfil | 15,872 | 66 |
| 89= | Luton | 50,364 | 66 |
| 89= | Lewes | 26,150 | 66 |
| 89= | Leeds | 219,902 | 66 |
| 89= | Kingston upon Hull, City of | 76,259 | 66 |
| 89= | Isle of Wight | 41,780 | 66 |
| 89= | Hillingdon | 68,685 | 66 |
| 89= | High Peak | 21,879 | 66 |
| 89= | Hastings | 29,229 | 66 |
| 89= | Harrow | 54,333 | 66 |
| 89= | Harrogate | 43,737 | 66 |
| 89= | Haringey | 75,592 | 66 |
| 89= | Gravesham | 24,675 | 66 |
| 89= | Folkestone and Hythe | 32,473 | 66 |
| 89= | Epsom and Ewell | 17,567 | 66 |
| 89= | Epping Forest | 30,336 | 66 |
| 89= | East Suffolk | 65,749 | 66 |
| 89= | Dorset | 98,046 | 66 |
| 89= | Doncaster | 82,648 | 66 |
| 89= | Darlington | 31,508 | 66 |
| 89= | Croydon | 98,332 | 66 |
| 89= | Coventry | 87,813 | 66 |
| 89= | Chesterfield | 26,669 | 66 |
| 89= | Carlisle | 29,152 | 66 |
| 89= | Cannock Chase | 24,689 | 66 |
| 89= | Caerphilly | 43,605 | 66 |
| 89= | Bromsgrove | 22,296 | 66 |
| 89= | Broadland | 31,671 | 66 |
| 89= | Brighton and Hove | 83,744 | 66 |
| 89= | Brentwood | 19,036 | 66 |
| 89= | Breckland | 35,668 | 66 |
| 89= | Boston | 20,002 | 66 |
| 89= | Bolton | 69,980 | 66 |
| 89= | Bath and North East Somerset | 47,166 | 66 |
| 89= | Barnsley | 60,490 | 66 |
| 153= | York | 47,413 | 67 |
| 153= | Wrexham | 30,019 | 67 |
| 153= | Worcester | 28,708 | 67 |
| 153= | Windsor and Maidenhead | 37,776 | 67 |
| 153= | Wigan | 79,711 | 67 |
| 153= | West Berkshire | 38,926 | 67 |
| 153= | Waverley | 30,674 | 67 |
| 153= | Wakefield | 120,587 | 67 |
| 153= | Thurrock | 41,488 | 67 |
| 153= | Three Rivers | 20,682 | 67 |
| 153= | Tameside | 61,440 | 67 |
| 153= | Swale | 37,417 | 67 |
| 153= | Surrey Heath | 20,744 | 67 |
| 153= | Stockton-on-Tees | 51,432 | 67 |
| 153= | Stafford | 34,196 | 67 |
| 153= | Southampton | 70,934 | 67 |
| 153= | South Tyneside | 42,392 | 67 |
| 153= | South Somerset | 46,331 | 67 |
| 153= | South Ribble | 26,188 | 67 |
| 153= | South Kesteven | 37,334 | 67 |
| 153= | Somerset West and Taunton | 45,235 | 67 |
| 153= | Solihull | 50,919 | 67 |
| 153= | Sheffield | 137,125 | 67 |
| 153= | Sedgemoor | 35,067 | 67 |
| 153= | Rutland | 9,896 | 67 |
| 153= | Rushcliffe | 29,351 | 67 |
| 153= | Runnymede | 22,266 | 67 |
| 153= | Rochdale | 53,456 | 67 |
| 153= | Reading | 46,558 | 67 |
| 153= | Nottingham | 102,584 | 67 |
| 153= | Northumberland | 88,162 | 67 |
| 153= | North Kesteven | 30,932 | 67 |
| 153= | Newark and Sherwood | 33,326 | 67 |
| 153= | Middlesbrough | 41,451 | 67 |
| 153= | Mid Suffolk | 25,911 | 67 |
| 153= | Merton | 50,727 | 67 |
| 153= | Mendip | 28,813 | 67 |
| 153= | Medway | 69,490 | 67 |
| 153= | Mansfield | 28,061 | 67 |
| 153= | Liverpool | 146,656 | 67 |
| 153= | Lincoln | 27,047 | 67 |
| 153= | Kensington and Chelsea | 58,750 | 67 |
| 153= | Ipswich | 35,668 | 67 |
| 153= | Hinckley and Bosworth | 28,251 | 67 |
| 153= | Havant | 30,132 | 67 |
| 153= | Hartlepool | 27,344 | 67 |
| 153= | Guildford | 33,812 | 67 |
| 153= | Gloucester | 33,536 | 67 |
| 153= | Gateshead | 49,808 | 67 |
| 153= | Flintshire | 37,020 | 67 |
| 153= | Fenland | 26,716 | 67 |
| 153= | Fareham | 25,147 | 67 |
| 153= | Elmbridge | 34,032 | 67 |
| 153= | Eastbourne | 29,509 | 67 |
| 153= | East Staffordshire | 32,176 | 67 |
| 153= | East Devon | 42,350 | 67 |
| 153= | East Cambridgeshire | 22,299 | 67 |
| 153= | Dover | 32,141 | 67 |
| 153= | County Durham | 148,455 | 67 |
| 153= | Chichester | 34,020 | 67 |
| 153= | Cheshire East | 107,758 | 67 |
| 153= | Cheltenham | 32,615 | 67 |
| 153= | Charnwood | 43,234 | 67 |
| 153= | Canterbury | 40,251 | 67 |
| 153= | Bristol, City of | 125,005 | 67 |
| 153= | Bridgend | 34,585 | 67 |
| 153= | Bournemouth, Christchurch and Poole | 110,816 | 67 |
| 153= | Bolsover | 20,712 | 67 |
| 153= | Blaby | 23,047 | 67 |
| 153= | Bassetlaw | 35,316 | 67 |
| 153= | Basildon | 41,256 | 67 |
| 153= | Barking and Dagenham | 50,901 | 67 |
| 153= | Babergh | 23,353 | 67 |
| 153= | Ashfield | 31,298 | 67 |
| 153= | Arun | 44,921 | 67 |
| 228= | Wychavon | 36,048 | 68 |
| 228= | Wiltshire | 128,335 | 68 |
| 228= | West Suffolk | 48,364 | 68 |
| 228= | West Northamptonshire | 103,748 | 68 |
| 228= | Watford | 24,364 | 68 |
| 228= | Warwick | 42,206 | 68 |
| 228= | Warrington | 49,211 | 68 |
| 228= | Vale of Glamorgan | 35,699 | 68 |
| 228= | Torfaen | 22,644 | 68 |
| 228= | Tonbridge and Malling | 30,434 | 68 |
| 228= | Tamworth | 17,820 | 68 |
| 228= | Sunderland | 86,363 | 68 |
| 228= | Stevenage | 20,902 | 68 |
| 228= | St Albans | 36,686 | 68 |
| 228= | South Oxfordshire | 36,643 | 68 |
| 228= | South Norfolk | 37,189 | 68 |
| 228= | Slough | 34,618 | 68 |
| 228= | Selby | 22,766 | 68 |
| 228= | Redditch | 20,769 | 68 |
| 228= | Preston | 42,487 | 68 |
| 228= | Plymouth | 75,303 | 68 |
| 228= | Oxford | 40,892 | 68 |
| 228= | Norwich | 40,639 | 68 |
| 228= | North West Leicestershire | 29,138 | 68 |
| 228= | North Tyneside | 55,686 | 68 |
| 228= | North Somerset | 58,486 | 68 |
| 228= | North Hertfordshire | 35,595 | 68 |
| 228= | Newport | 36,719 | 68 |
| 228= | Newcastle upon Tyne | 79,318 | 68 |
| 228= | Monmouthshire | 23,174 | 68 |
| 228= | Lichfield | 25,871 | 68 |
| 228= | Lewisham | 82,061 | 68 |
| 228= | Lambeth | 96,468 | 68 |
| 228= | Huntingdonshire | 47,173 | 68 |
| 228= | Hounslow | 62,776 | 68 |
| 228= | Horsham | 37,196 | 68 |
| 228= | Hertsmere | 24,635 | 68 |
| 228= | Harlow | 27,768 | 68 |
| 228= | Halton | 32,083 | 68 |
| 228= | Gosport | 21,371 | 68 |
| 228= | East Hertfordshire | 35,696 | 68 |
| 228= | Ealing | 90,525 | 68 |
| 228= | Dacorum | 34,246 | 68 |
| 228= | Chorley | 28,366 | 68 |
| 228= | Cheshire West and Chester | 88,912 | 68 |
| 228= | Chelmsford | 43,605 | 68 |
| 228= | Cardiff | 98,437 | 68 |
| 228= | Buckinghamshire | 141,704 | 68 |
| 228= | Broxbourne | 21,995 | 68 |
| 228= | Brent | 82,350 | 68 |
| 228= | Braintree | 36,819 | 68 |
| 228= | Barnet | 102,033 | 68 |
| 280= | Woking | 27,605 | 69 |
| 280= | Winchester | 32,406 | 69 |
| 280= | West Oxfordshire | 30,589 | 69 |
| 280= | Welwyn Hatfield | 27,045 | 69 |
| 280= | Wandsworth | 102,295 | 69 |
| 280= | Uttlesford | 21,213 | 69 |
| 280= | Swindon | 56,521 | 69 |
| 280= | Stratford-on-Avon | 40,579 | 69 |
| 280= | South Gloucestershire | 67,854 | 69 |
| 280= | Rushmoor | 26,256 | 69 |
| 280= | Rugby | 27,604 | 69 |
| 280= | Reigate and Banstead | 37,994 | 69 |
| 280= | North Northamptonshire | 88,466 | 69 |
| 280= | Mid Sussex | 39,235 | 69 |
| 280= | Manchester | 169,366 | 69 |
| 280= | Maidstone | 46,842 | 69 |
| 280= | Hart | 23,880 | 69 |
| 280= | Harborough | 25,388 | 69 |
| 280= | Hammersmith and Fulham | 63,360 | 69 |
| 280= | Exeter | 32,942 | 69 |
| 280= | East Hampshire | 31,392 | 69 |
| 280= | Colchester | 51,156 | 69 |
| 280= | Camden | 69,317 | 69 |
| 280= | Ashford | 32,421 | 69 |
| 304= | Wokingham | 42,429 | 70 |
| 304= | Westminster | 88,528 | 70 |
| 304= | Vale of White Horse | 36,653 | 70 |
| 304= | Tewkesbury | 24,966 | 70 |
| 304= | Test Valley | 32,250 | 70 |
| 304= | Telford and Wrekin | 48,757 | 70 |
| 304= | South Derbyshire | 29,079 | 70 |
| 304= | South Cambridgeshire | 41,527 | 70 |
| 304= | Peterborough | 60,014 | 70 |
| 304= | Newham | 87,128 | 70 |
| 304= | Islington | 69,207 | 70 |
| 304= | Eastleigh | 35,379 | 70 |
| 304= | Dartford | 28,993 | 70 |
| 304= | Crawley | 26,218 | 70 |
| 304= | Cherwell | 42,591 | 70 |
| 304= | Central Bedfordshire | 76,156 | 70 |
| 304= | Bracknell Forest | 31,655 | 70 |
| 304= | Bedford | 48,141 | 70 |
| 304= | Basingstoke and Deane | 43,195 | 70 |
| 304= | Knowsley | 46,339 | 70 |
| 324= | Milton Keynes | 75,101 | 71 |
| 324= | Hackney | 75,877 | 71 |
| 324= | Greenwich | 75,853 | 71 |
| 324= | Cambridge | 36,738 | 71 |
| 328= | Southwark | 86,598 | 72 |
| 328= | Salford | 92,126 | 72 |
| 330 | City of London | 4,545 | 74 |
| 331 | Tower Hamlets | 102,340 | 77 |
Source: Uswitch.com